Tag Archives: Computer science

JavaScript optimization. Optimizing IF statements.

IF statements in JavaScript and the normal world!

In fact every normal developer will try to make his code as readable as possible. In a normal world a JavaScript IF statement will look like so:

if ( expression ) myFunc();

where expression is something that can be either true or false and myFunc is just an example what can be called if the expression is true.

But that’s JavaScript?!

Yes, and just because is JavaScript every single character is important. Actually you can convert the row above with that one bellow:

expression && myFunc()

Than if expression is faulty myFunc() will not be called. That is really extreme and in the same time is quite clear to read.

Firebug’s console.profile vs console.time

Firebug’s console.time!

This post is directly related to the previous post where I explain how to use the Firebug’s console object and in that case its time method. That is really powerful and gives the opportunity to track the performance of a sample JavaScript chunk of code. What it does not do is to give you a more detailed profile of that particular JS code.

That’s because the console’s profile method works on functions and if you’d like to profile a loop it will give you there’s nothing to be profiled. One workaround to that is to use closures.

JavaScript closures

A JavaScript closure is to make an anonymous function and to put the code in it, like so:

(function() {
 for (var i = 100000; i--; ) {
  var a = new Array();
 }
})();

Firebug’s console.profile()

That code can be than wrapped with both console.profile() and console.profileEnd() in something like:

console.profile('my profile');
(function() {
 for ( var i = 100000; i--; ) {
  var a  = new Array();
 }
})();
console.profileEnd('my profile');

That will give a more precise measurement like that one shown on the picture bellow:

firebug console.profile

Profiling JavaScript with Firebug. console.profile() & console.time()!

Firebug and the console object

Although my impression is that most of the web developers use Firefox and most of them are using Firebug, I’m not sure that they use the full potential of this brilliant software.

Firebug’s console view

Firebug is a very powerful tool helping those like me doing his job. But what’s behind the mostly used Firebug’s tools and what’s in the API.

console.log()

For a typical JavaScript programmer the console.log() function is one of his best friends. It can dump useful information in the console tab of the Firebug making everything quite clear. But have you ever asked yourself how to improve your code, how to measure its performance against some constructions.

Performance of JavaScript

I’m sure many of us have read enough articles out in the web about JS performance. Nowadays when the web apps become bigger and bigger, this topic is rising from the bottom of the interesting topics pool. Now everybody’s concerned about it’s app performance and speed.

You’ve probably heart about some basic advices. What to use, what not to use. In a short example I’ll mention only that everybody knows that .appendChild is far slower than the innerHTML. But why is that? How can be sure it’s true.

As I wrote recently you should instantiate your new arrays in javascript with the following construction:

var a = [];

instead of:

var a = new Array();

but as I’ll write here that’s not always true.

console.profile()

One of the useful methods of the Firebug’s console object is the profile() method. It gives you the power to measure timing and performance of any JS function. As described in the Firebug’s web page:

The high-fi approach is to use the JavaScript profiler. Just call console.profile() before the code you want to measure, and then console.profileEnd() afterwards. Firebug will log a detailed report about how much time was spent in every function call in between.

With the simple construction like:

<html>
<body>
<script>
    myFunc = function() {
        var a = [];
    }				

   console.profile();
   myFunc();
   console.profileEnd();
</script>
</body>
</html>

Firebug’s profile output

The simple problem is that thus you cannot just measure some code that’s not a function. This will result in empty profile output in the console’s view:

But hopefully there comes the other method of the console object.

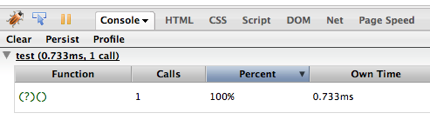
console.time()

It gives anything you’d like to know even if it’s not closed into a function.

Note: remember that both profile and time methods goes with their related profileEnd and timeEnd methods. You’re supposed to enclose the chunk of code you measure with that to be sure that the Firebug’s console will stop the profilers on time.

Now you can simply ask the profiler: what is faster?
Writing a jQuery plugin – (part 2). Sample plugin.

To be breve I’ll write some sample code and quickly describe it afterwards. So what’s a plugin. Lets make a simple logging plugin that overrides the console.log function and prevents MSIE browser to throw an error when this function misses.

The thing I’d like to achieve is something like:

$.log(‘my message’);

when I call it from a pure jQuery code.

function log( msg ) {
   console.log && console.log(msg);
}

That code looks quite correct, but to make all this into a jQuery plugin will need something more.

(function(jquery) {

   var log = function( msg ) {
      console.log && console.log(msg);
   };

   jquery.log = log;

}(jQuery));

After that we can call the $.log function with success and to perform logging of everything we want into the Firebug’s console.

The simple technique used here is a JavaScript closure and simple exportation of the single function log.

Speed up the JavaScript. It can change dramatically the user experience.

JavaScript in a modern web application

If someone asks you what is the javascript in modern web developer, probably you should answer it’s almost the half of the traffic of your site and it’s almost everything when dealing with user experience.

Today’s big web apps are useless without it AJAX/JS part. Think about Facebook, Google products, Twitter, Yahoo!, Youtube.

Actually they made this a standart. The times when you used to use JavaScript as a helper language just to figure out how a drop down menu will work are far way in the past. Now JavaScript is everything in a rich web sites. With no JS they will be no rich at all! Then it comes the question how to improve sites with lots of javascript. Actually one of the main problems in the web now is that JavaScript is blocking content.

Blocked by the JavaScript

What that means at all is that until the browser receives and parses the JavaScript file/s it doesn’t process anything else, it even doesn’t load any other resources. Now you can imagine how big the problem is. When it comes to large files more than 100K the user experience will be very bad!

Optimize the web? What about optimizing JavaScript!

If the problem is so big as I described above why should we doubt about where to start with the optimization process? But of course with the JavaScript and the natural question that rises is how this can be optimized at all?

Three steps

Like me, many of you may heart of some techniques that improve javascript performance. Here are some I was able to select as important:

1. minify/compress

That’s rule number one. If everything that is a JavaScript file is processed once it arrives to the client than make it smaller and make it go faster trough the wire. Actually one technique to speed up things more is to concatenated all the files you have into one single big file. Although this will not spend you some space will reduce the HTTP requests and therefore speed up the loading process. Good tools that you can use to minify javascript files are the Yahoo’s YUI Compressor, that beside that compresses CSS and Google Closure Compiler. Both are extremely useful and by the last measurements the Google’s Compiler is even better, but it’s up to you to decide which one to pick up.

2 .write fast and smart code

You can minify everything that’s JavaScript and the code may remain slow. But why is that? That’s because the JavaScript is written in a bad way. You know there are many resources in the web describing what is a bad and what is a good practice when writing JS. Even more you can measure it by yourself if you’d like to use the Firebug’s profiler. That’s a good start to avoid bad practices.

3. improve loading – lazy loading

That’s a bit more complicated. If there’s a really big javascript file after compressing and concatenating all the JS functionality remains big. How to avoid that? Simply let’s the user to see the most important functionality and than load the entire app. Some good tutorials about lazy loading again can be found online. Don’t hesitate to search about.

Beside this really basic advices I’ll continue to write in my blog about specific techniques how to improve the JavaScript as this is one of the most interesting parts of web development by me.