Category Archives: javascript

JavaScript optimization. Optimizing IF statements.

IF statements in JavaScript and the normal world!

In fact every normal developer will try to make his code as readable as possible. In a normal world a JavaScript IF statement will look like so:

if ( expression ) myFunc();

where expression is something that can be either true or false and myFunc is just an example what can be called if the expression is true.

But that’s JavaScript?!

Yes, and just because is JavaScript every single character is important. Actually you can convert the row above with that one bellow:

expression && myFunc()

Than if expression is faulty myFunc() will not be called. That is really extreme and in the same time is quite clear to read.

Fancy tooltips with jQuery

I was decided to write this post from long time ago and now I’m pretty sure it has to be published. What I see in my practice and my browsing in the web there are too many old fashioned tooltips all over the web, as web developer don’t know how to make pretty good fancy tooltips.

That’s why I decided to show what’s not and what is fancy tooltip, with the help of jQuery. Of course don’t hesitate to make with every other library or pure JS code.

What is NOT fancy?

It’s not fancy when the tooltip is with fixed position. In the example here I made one pretty small sample:

What is fancy?

In the other side you can make the tooltip moving with the mouse pointer which is way better, as you can see here:

Firebug’s console.profile vs console.time

Firebug’s console.time!

This post is directly related to the previous post where I explain how to use the Firebug’s console object and in that case its time method. That is really powerful and gives the opportunity to track the performance of a sample JavaScript chunk of code. What it does not do is to give you a more detailed profile of that particular JS code.

That’s because the console’s profile method works on functions and if you’d like to profile a loop it will give you there’s nothing to be profiled. One workaround to that is to use closures.

JavaScript closures

A JavaScript closure is to make an anonymous function and to put the code in it, like so:

(function() {
 for (var i = 100000; i--; ) {
  var a = new Array();
 }
})();

Firebug’s console.profile()

That code can be than wrapped with both console.profile() and console.profileEnd() in something like:

console.profile('my profile');
(function() {
 for ( var i = 100000; i--; ) {
  var a  = new Array();
 }
})();
console.profileEnd('my profile');

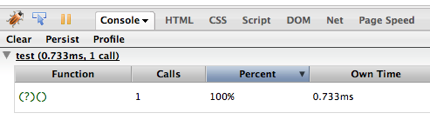
That will give a more precise measurement like that one shown on the picture bellow:

firebug console.profile

Firebug’s console.time() accuracy

Firebug’s console.time()

As I wrote in my previous post Firebug is giving the ability to test performance of any chunk of JavaScript code with its console.time() method. One of the most discussed topics about performance and one of the most recently examples given in the web is the way to instanciate a new empty array in JavaScript.

new Array() vs. []

Which one is faster? This is the question we’ve seen so many times in the web. I decided to check it with the console.time() method. For my experiment I made 100000 new arrays both way:

var arr = new Array();

and

var arr = [];

Thus the sample code of the first experiment is:

<html>
 <body>
  <script>
   console.time('profile 1');
   for ( var i=0; i < 100000; i++) {
      var arr = new Array();
   }
   console.timeEnd('profile 1');
  </script>
 </body>
</html>

and the results are 12 ms. OK, so far so good. Now I’d like to test the same construction with the other way to make new array instance:

<html>
 <body>
  <script>
   console.time('profile 2');
   for ( var i=0; i < 100000; i++) {
      var arr = [];}
   console.timeEnd('profile 2');
  </script>
 </body>
</html>

And the result is pretty much the same – 11 ms. That’s why I choose to increase the number of iterations of this loop from 100,000 to 10,000,000 and the second chunk of code using the construction arr = [] is finishing its job for around 3400ms or a little bit more than 3 seconds, while the first one is a little bit faster – 2450ms or faster with almost a second.

What if we merge both chunks?

I decided to concatenate the code in something like:

<html>
 <body>
  <script>
  console.time('profile 1');
   for ( var i=0; i < 100000; i++) {
    var arr = new Array();
   }
  console.timeEnd('profile 1');
  console.time('profile 2');
   for ( var i=0; i < 100000; i++) {
    var arr = [];
   }
  console.timeEnd('profile 2');
  </script>
 </body>
</html>

results:

and yet again the same results as if they were separated tests, which of course seems to be pretty natural.

Use console.time()!

That’s the way to get clear example of how fast your code is. Actually this is not a pure sense profile, where you can get minimum and maximum performance times but it gives pretty accurate values.

Profiling JavaScript with Firebug. console.profile() & console.time()!

Firebug and the console object

Although my impression is that most of the web developers use Firefox and most of them are using Firebug, I’m not sure that they use the full potential of this brilliant software.

Firebug’s console view

Firebug is a very powerful tool helping those like me doing his job. But what’s behind the mostly used Firebug’s tools and what’s in the API.

console.log()

For a typical JavaScript programmer the console.log() function is one of his best friends. It can dump useful information in the console tab of the Firebug making everything quite clear. But have you ever asked yourself how to improve your code, how to measure its performance against some constructions.

Performance of JavaScript

I’m sure many of us have read enough articles out in the web about JS performance. Nowadays when the web apps become bigger and bigger, this topic is rising from the bottom of the interesting topics pool. Now everybody’s concerned about it’s app performance and speed.

You’ve probably heart about some basic advices. What to use, what not to use. In a short example I’ll mention only that everybody knows that .appendChild is far slower than the innerHTML. But why is that? How can be sure it’s true.

As I wrote recently you should instantiate your new arrays in javascript with the following construction:

var a = [];

instead of:

var a = new Array();

but as I’ll write here that’s not always true.

console.profile()

One of the useful methods of the Firebug’s console object is the profile() method. It gives you the power to measure timing and performance of any JS function. As described in the Firebug’s web page:

The high-fi approach is to use the JavaScript profiler. Just call console.profile() before the code you want to measure, and then console.profileEnd() afterwards. Firebug will log a detailed report about how much time was spent in every function call in between.

With the simple construction like:

<html>
<body>
<script>
    myFunc = function() {
        var a = [];
    }				

   console.profile();
   myFunc();
   console.profileEnd();
</script>
</body>
</html>

Firebug’s profile output

The simple problem is that thus you cannot just measure some code that’s not a function. This will result in empty profile output in the console’s view:

But hopefully there comes the other method of the console object.

console.time()

It gives anything you’d like to know even if it’s not closed into a function.

Note: remember that both profile and time methods goes with their related profileEnd and timeEnd methods. You’re supposed to enclose the chunk of code you measure with that to be sure that the Firebug’s console will stop the profilers on time.

Now you can simply ask the profiler: what is faster?